Nonprofit CRM reporting is essential for organizations to drive effective decision-making based upon their donor data. In this blog post, we define CRM reporting including report types, benefits of reporting, helpful reports, as well as tips to ensure you generate the most impact from your CRM reporting.
Introduction: What is CRM Reporting?
A nonprofit CRM houses all your donor data in one system of record. This platform contains donor demographic details, interest history, wealth information, previous gift history, and many more data points. All this donor data informs your fundraising campaigns and allows your organization to strategically solicit your donor base.
CRM reporting is a critical feature of a nonprofit CRM that allows users to manipulate and analyze all this data. CRM systems may have reports that come standard and others, such as StratusLIVE 365, customize these reports to meet the needs of nonprofit professionals.
What are the Benefits of CRM Reporting?
CRM reports are essential for nonprofits because they provide a clear view of the organization’s financial and operational performance. They also provide valuable insights into the organization’s donors, volunteers, and constituents. With CRM reporting, nonprofit professionals make informed decisions that contribute to the organization’s goals.
Here are a few benefits of CRM reports:
- Provide a detailed overview of the organization’s finances
- Determine which fundraising campaigns are most effective
- Assess how well an organization is meeting its goals
- Empower staff members to focus on activities that drive results
How to Create a Successful CRM Report for your Nonprofit
The first step in creating a successful CRM report is to define your report’s desired outcome. What decision do you hope to make, or information do you hope to gain by creating this report? This information will influence the report’s format and help identify the data points necessary to create the report.
Second, it is important to determine the method you would like to use to compile or discover the information in your database. Some report methods may include charts or dashboards.
Dashboards in particular allow decision-makers to quickly make databased business decisions tailored to their specific roles. These dashboards enable users to view donor activities, donations, pledges, marketing, and events, as well as other areas of the system.
CRM platforms offer end users the capability to create and save dynamic, user-defined dashboards. Other systems such as StratusLIVE 365 also provide many packaged dashboards and frame-based reports.
Helpful Reports for Nonprofit Fundraisers
Nonprofit fundraisers track a plethora of donor data. With all this information, it can be overwhelming to focus on actionable information that drives toward goals. Here are two report types that can provide valuable insights to development professionals:
1. Churn Analysis
Donor churn is the percentage of donors who choose not to donate again. To effectively use this information, let’s consider this example: it’s close to the year-end, and your organization is 25% short of your fundraising goal. Within your CRM system, you can conduct a churn analysis to develop two lists of donors. The first list is a list of donors who contributed last year but unfortunately not this year (LYBUNT). The second list is a list of donors who contribute some year but unfortunately not this year (SYBUNT). These donors represent a prime audience to re-engage. Your team can export the summarized data or the underlying Excel data for a mail merge to start a targeted campaign.
2. What-if Analysis
What-if Analyses allow you to tweak one variable to determine the resulting impact on your campaign. For example, you can utilize your nonprofit CRM to review your annual campaign data. You can pinpoint the revenue raised by each campaign and drill down further to view each individual campaign activity group including each average response rate. You may determine that one specific email message secured a higher average response rate than another. This informs your team to perform further analysis to determine the key difference that generated the success.
Bring Donor Data to Life with Data Visualization
Beyond general reporting with charts and graphs, business analytics brings your donor data to life. With data visualization software such as Microsoft Power BI or Tableau, your organization leverages analytical dashboards for key metrics and audience analysis. These tools integrate with your CRM, allowing you to display more data at once and inspire action.
The benefits of Power BI Campaign Dashboards include:
• Connecting real-time data and constituent interactions to get an end-to-end view of what activities drive your data.
• Refining financial forecasts by modeling and analyzing data across multiple dimensions.
• Charting organizational performance in real time with analytics based on historical and predictive data
Here are two examples of Power BI Dashboards within StratusLIVE 365:
1. Track your Campaign ROI with Campaign Analysis Dashboard
A “Campaign Analysis Dashboard” empowers your organization to make informed, data driven decisions surrounding your fundraising strategies all at a glance.
This dashboard provides real-time information to help you manage your fundraising activities. You can easily see all pledged or planned giving for forecasting as well as evaluate the success of your marketing campaigns. You can use the data analysis to enable personalized donor interactions and make them feel recognized and more connected to your mission.
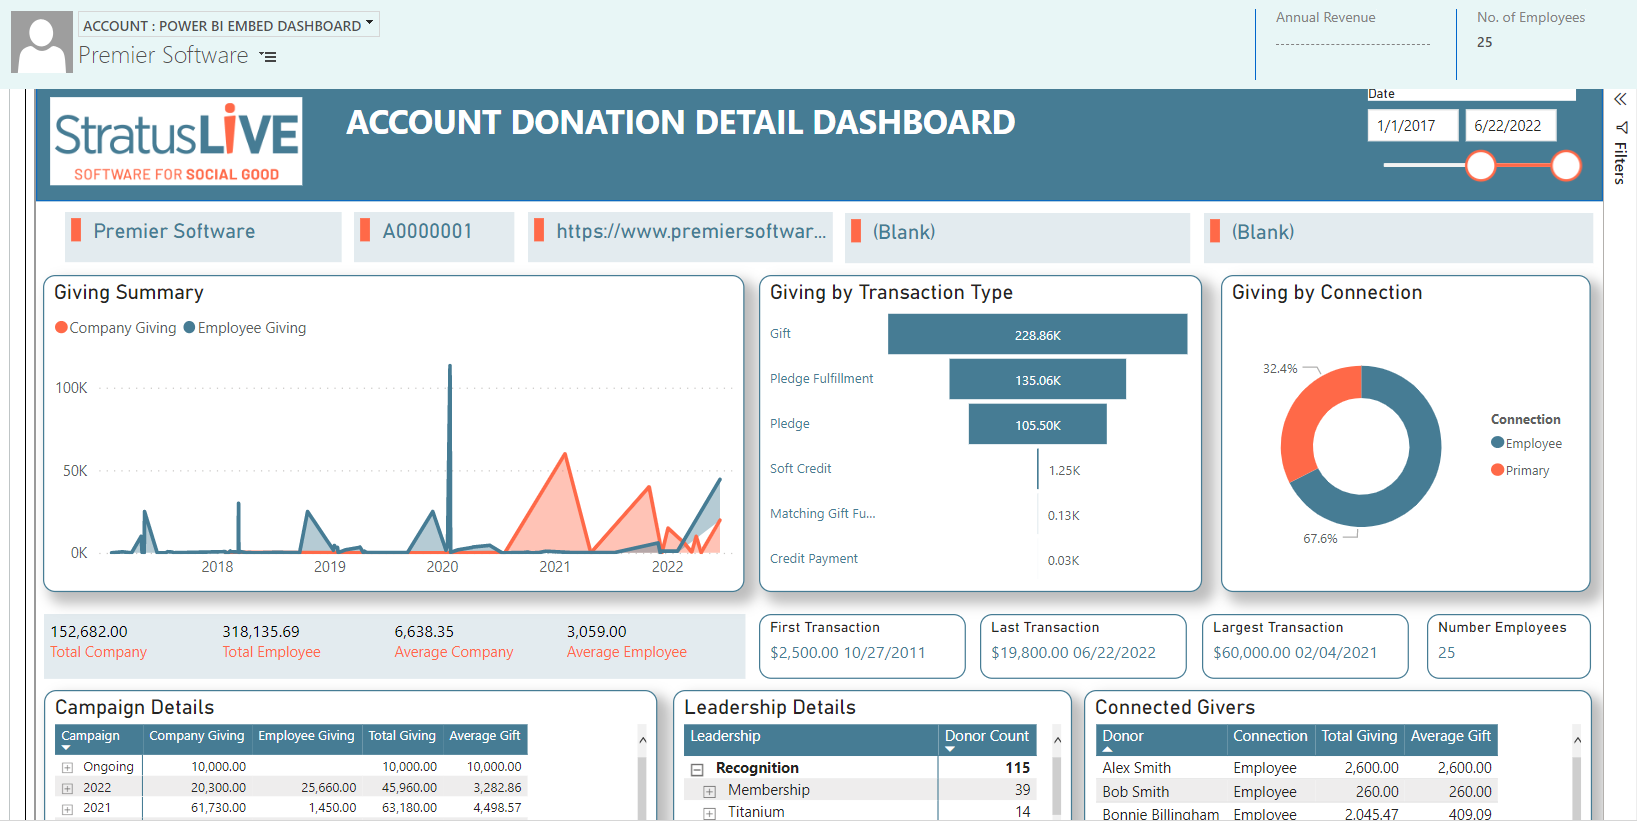
2. View Account and Contact-based Analytics with Donor Influence Dashboard and Account Donation Detail Dashboard
Using donor analytics can help your nonprofit make informed decisions when pursuing constituent relationships. Donor analytics break down and interpret donor data to help you understand trends in your donor base and provide actionable insights. Then you can use that data to structure your fundraising campaigns.
In addition to digging into donor or contact-based analytics, you can view account-based analytics for corporate campaigns you may run. If your corporate partners have a giving program, you can use analytics to compare year over year data to see exactly how and where you're making an impact. Using analytics, you can easily break down which programs generate the most revenue. You can use data analytics to factor in time of donation, the donor’s age, donation size, location, and the donor's past event attendance or even volunteer engagement into their strategy.
Conclusion
Many nonprofit organizations struggle to operationalize their donor data. With robust CRM reporting, your organization can focus on the data that matters most while you make informed, actionable decisions. With options for general reports and more advanced data visualization, your organization can leverage these robust tools to ensure your organization meets your goals and objectives.
Does your organization have access to reports when and where you need them? With StratusLIVE 365, you have powerful reporting at your fingertips through both out-of-the box dashboards and powerful data visualizations.